Market Opinion for Trading Week 29 Apr ~ 3 May 2013
Have fun trading !~ |
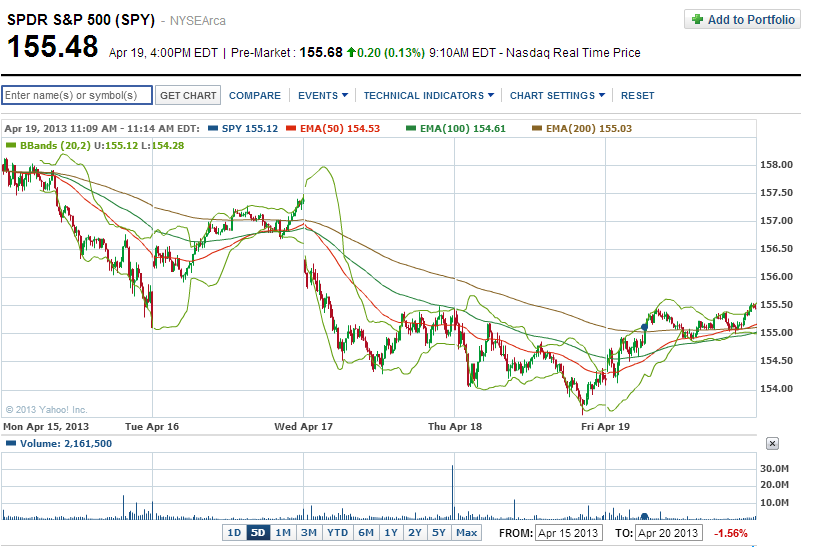
| SPY - 5 days |
Week closed at 158.24. Week open low and close higher. Sudden drop on Tue, due to Associated Press twitter account hacked and release a tweet about white house and obama. Other than that bulls are steady climbing up but lack the drive. Seem like 160 resistant holding well for now. Candles are hovering just above the EMA50,100,200. Note this week we are entering the mth of may.
Accuracy : 5/8

Psychology
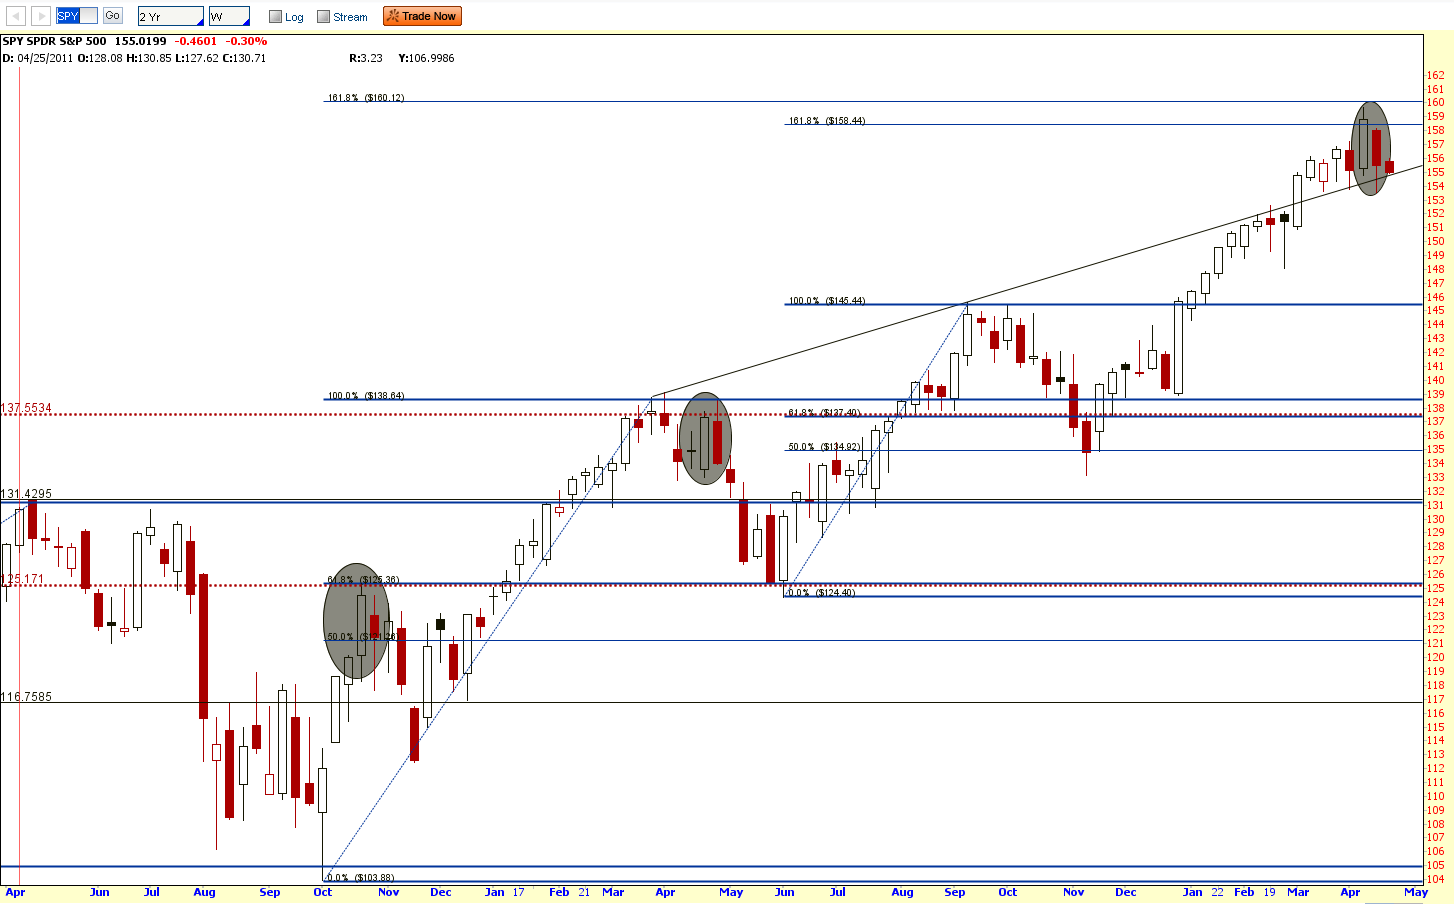
Check out the weekly candle stick pattern. What's your feeling of the candle ?
Almost equal length upper and lower shadow. Creating higher low and higher high compare to last week candle. Apparently either side want to give in first. One of the longer than average candle body. Giving us a bullish sign with strength but somehow I m very wary about it. Almost a consolidating pattern near the resistance zone of 160. Be cautious of the breakup as it could come in a volatile fashion.
Pattern
First week of May tend to be bearish base on the past 5 years data on SPY weekly candles since 2008.
4 out of the 5 first week candles of may are bearish.
Earnings started
As per last week,
Technical
Resistance at 160 and support at 153
Next support level at 150
No go zone
Anything not higher than 158+5=163 and anything not lower than 153-5=148
Opinion of the Market next week : bearish
Check out the weekly candle stick pattern. What's your feeling of the candle ?
Almost equal length upper and lower shadow. Creating higher low and higher high compare to last week candle. Apparently either side want to give in first. One of the longer than average candle body. Giving us a bullish sign with strength but somehow I m very wary about it. Almost a consolidating pattern near the resistance zone of 160. Be cautious of the breakup as it could come in a volatile fashion.
 |
| SPY - Weekly Pattern |
Pattern
4 out of the 5 first week candles of may are bearish.
Earnings started
S&P 500's Q1 2013 Results So Far
As of April 25, 271 companies in the S&P 500 reported earnings and 189 beat analyst estimates, which represents a beat rate of 69.7%. In the last three quarters, the beat rate ranged from 63.3% - 64.8%.
Of the 271 S&P 500 companies that have reported earnings to date for the quarter, 73% have reported earnings above estimates. This percentage is slightly above the average of 70% recorded over the past four quarters. However, only 44% of companies have reported sales above estimates. This percentage is well below the average of 52% recorded over the past four quarters. If 44% is the final percentage, it will mark the third time in the last four quarters that the percentage of companies reporting revenue above estimates finished below 50%. As a result, the revenue growth rate for the quarter has continued to decline over the past month, while the earnings growth has rebounded to the levels expected at the start of the quarter (December 31).
For the first quarter overall, the blended earnings growth rate is 2.1% this week, above last week’s growth rate of 0.3%. Upside earnings surprises reported by companies across multiple sectors were responsible for the improvement in the growth rate during the past week. All ten sectors saw an improvement in earnings growth during the week. On March 31, the Q1 earnings growth rate for the index was -0.7%. All ten sectors have witnessed an increase in earnings growth rates since that date as well, led by the Telecom Services sector.
The index is now reporting earnings growth in Q1 (2.1%). If the final number is positive, it will mark the second consecutive quarter of earnings growth for the index. Eight of the ten sectors are reporting an earnings increase for the quarter, led by the Utilities, Financials, and Telecom Services sectors. On the other hand, the Information Technology sector is reporting the lowest earnings growth. The blended revenue growth rate for the index for Q1 is -0.6%, down from an estimate of 0.4% at the end of the quarter.
Corporations and analysts are lowering earnings expectations for Q2 2013. In terms of preannouncements, 48 companies have issued negative EPS guidance for Q2 2013, while 11 companies have issued positive EPS guidance. Analysts have taken down EPS estimates also, as the estimated earnings growth for Q2 2013 has dropped to 2.4% today from an expectation of 4.5% on March 31.
The upcoming week marks the final peak week of the Q1 2013 earnings season, as two Dow components and 137 S&P 500 companies are scheduled to report earnings for Q1 2013 during the week.
Q1 earnings season is far from over. Facebook (FB), Comcast (CMCSA), Visa (V) and MasterCard (MA) report Wednesday. Kellogg (K) and Kraft Foods (KRFT) are on tap Thursday.

As per last week,
After seeing this, here comes the question, if I m the big boys what would I do to make money ? Almost everyone out there are anticipating the sell in may and go away, I would push the counter to break above the psychology resistance of 160 zone before joining the sell in may and go away. Well at the same time I will be hedge leaning towards shorting too. KaChing $
Technical
Next support level at 150
No go zone
Anything not higher than 158+5=163 and anything not lower than 153-5=148
Opinion of the Market next week : bearish
PS : Last week I was reading the news on new cases of H7N9 spreading in china and taiwan. Then came a thought that people will be fearful and want to do vaccination. So did a google search and found out that GSK is one of the companies that provide the vacciantion drug.
Next I went to check on GSK chart, man I missed the boat. GSK was already running parabolic upwards. Will the trend continue ?